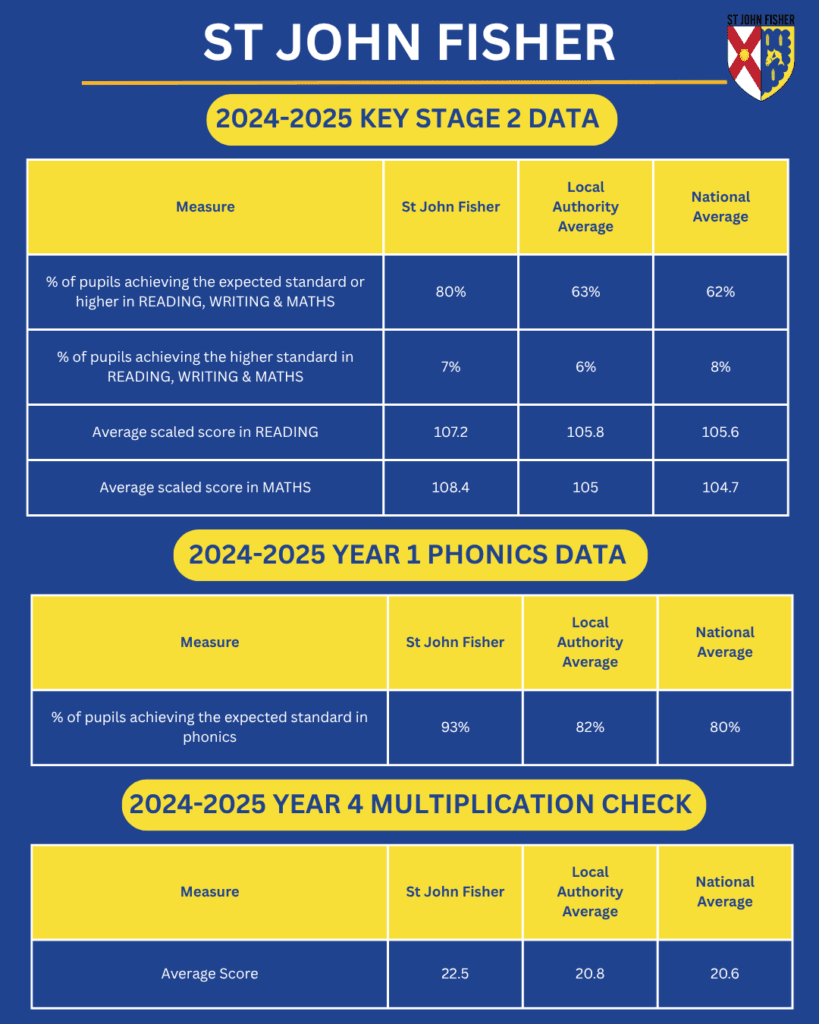
2023-24 Results

Saint John Fisher Catholic Voluntary Academy, Wigston, Leicestershire – Compare school and college performance data in England – GOV.UK

We are pleased to share our recent Key Stage 2 results, which demonstrate the hard work and dedication of our pupils and staff.

Key Achievements:

  • Meeting Expected Standard: 72% of our pupils achieved the expected standard in reading, writing and maths, exceeding both the local authority and national averages of 61%.
  • Reading Performance: Our pupils achieved an average reading score of 110, significantly above the local authority and national averages of 105.
  • Maths Performance: Our pupils achieved an average maths score of 109, also exceeding the local authority average of 105 and the national average of 104.

These results highlight the strong progress our pupils make during their time at our school. We are committed to providing a high-quality education that enables all pupils to reach their full potential.

We will continue to focus on:

  • Maintaining and improving our high standards in reading, writing and maths.
  • Supporting all pupils to achieve their best, including those aiming for higher standards.
  • Utilising data to inform our teaching and learning strategies.

Phonics

St John Fisher CVA demonstrates exceptionally strong performance in phonics. The 2024 Year 1 phonics screening check results show that 93% of pupils achieved the expected standard. This places the school within the top 10% nationally (90th percentile). This excellent outcome reflects a consistently high standard of phonics teaching and learning within the school.

We are proud of our pupils’ achievements and thank our staff, parents and carers for their continued support.

2022 – 23 Results

National data was released in Autumn 2023 which compares schools across the country. We are absolutely delighted that SJF is in the top 10% of all schools for progress in reading, writing and maths. This means that, as children journey through the school, they make more progress in reading, writing and maths than 90% of schools across the country.

This is a huge testament to the hard work of our pupils, the dedication and commitment of
our teaching and staff team and the support of our highly-valued parents and carers.

School results 2021

The Government has announced  that it will not publish any school or college level educational performance data based on tests, assessments or exams for 2021. This update published here  clarifies what this means for the way school and college accountability will operate for 2020/21.

School results 2020

The Government has announced  that it will not publish any school or college level educational performance data based on tests, assessments or exams for 2020. This update published here  clarifies what this means for the way school and college accountability will operate for 2019/20.

School Results 2019

Performance table link

We are delighted with our pupil outcomes this year. In EYFS (Reception) the school is ABOVE national standards for the 4th year in a row. Well done the Early Years team and thank you! We really are proud of what we have achieved in Early Years with our fantastic children and staff.

EYFSP 2016 2017 2018 National
Good level of development 80% 77% 75% 71%


IN KEY STAGE 1 (YEAR 2)


Reading St John Fisher 2019 National 2018
Expected standard 75% 76%
Higher standard 11% 25%
Maths St John Fisher 2019 National 2018
Expected standard 71% 75%
Higher standard 11% 21%


 Writing St John Fisher 2019 National 2018
Expected standard 68% 68%
Greater Depth Standard 4% 16%


In phonics we have achieved ABOVE national since the beginning of the phonics screening. Our phonics results have improved every year for the last 4 years which means the majority of the children go to Year 2 and Key Stage 2 reading well. Well done to the pupils and all the staff in achieving this!


Phonics

(End of Key Stage 1)

2017 2018 2019
National
Expected level  

97%


93%


100%


91%


The pupils in Year 6 (and staff) have worked incredibly hard all year for their SATs tests which were in May. The tests are very challenging and we are really pleased that the pupils achieved ABOVE national for mathematics, reading grammar and in line with National for writing.

Progress is above national and puts us in the top 20% of schools in the country for Reading and Maths


Combined reading , writing and maths St John Fisher 2019 National 2019
Expected standard 77% 65%
Higher standard 13% 11%


Reading St John Fisher 2019 National 2019
Expected standard 87% 73%
Higher standard 37% 27%
Progress score  2.9 0
Maths St John Fisher 2019 National 2019
Expected standard 90% 79%
Higher standard 37 % 27%
Progress score  2.7


SPAG St John Fisher 2019 National
Expected standard 87% 77%
Greater Depth Standard 43% 36%
Writing St John Fisher 2019 National
Expected standard 77% 78%
Greater Depth Standard 23% 20%
Progress score  0.5


https://www.compare-school-performance.service.gov.uk/school/138090/saint-john-fisher-catholic-voluntary-academy%2c-wigston%2c-leicestershire/primary

HEADLINE DATA

2018

EYFS

Progress Result
Achieving good level of development 76%


Phonics Screening Checks Pass Rate
Year 1 90%
Year 2 (Re-sits) 0%


Key Stage 1 (End of Year 2)

Subject Reaching Expected Standard* (1) Above Expected Standard
Reading 87% 23%
Writing 73% 13%
Mathematics 83% 17%

Key Stage 2 (End of Year 6)

Subject Reaching Expected Standard* (1) Above Expected Standard Average

Points

score

Reading 76% 17% 104
Writing 72% 24% n/a
Grammar, Punctuation and Spelling 72% 34% 105.4
Mathematics 76% 21% 104
Reading, Writing and Mathematics Combined 66% 7% n/a

2017

Here are our assessment results for 2017 (Academic Year 2016/17).

Headlines

St John Fisher continue to have high expectations and set high standards as can be seen from our most recent data results .

Again for KS2 results, we are the  top performing school  in Oadby and Wigston when it comes to  year 6 SATS results.

Well done to all.


EYFS

Progress Result
Achieving good level of development 80%

Phonics Screening Checks

Year Pass Rate
Year 1 94%
Year 2 (Re-sits) 100%

Key Stage 1 (End of Year 2)

Subject Reaching Expected Standard* (1) Above Expected Standard
Reading 83% 30%
Writing 70% 17%
Mathematics 80% 13%


Key Stage 2 (End of Year 6)

Subject Reaching Expected Standard* (1) Above Expected Standard Average

Points

score

Reading 80% 40% 105.7
Writing 80% 28% n/a
Grammar, Punctuation and Spelling 92% 28% 106.9
Mathematics 84% 16% 103.6
Reading, Writing and Mathematics Combined 76%** 8% n/a


Progress (From KS1 to KS2)

Subject Average progress
Reading 2
Writing 2.2
Mathematics 0.1